Welcoming our friends from The David Lin Report.
This is our latest newsletter alongside Gold related clips from TDLR.
STLLR News
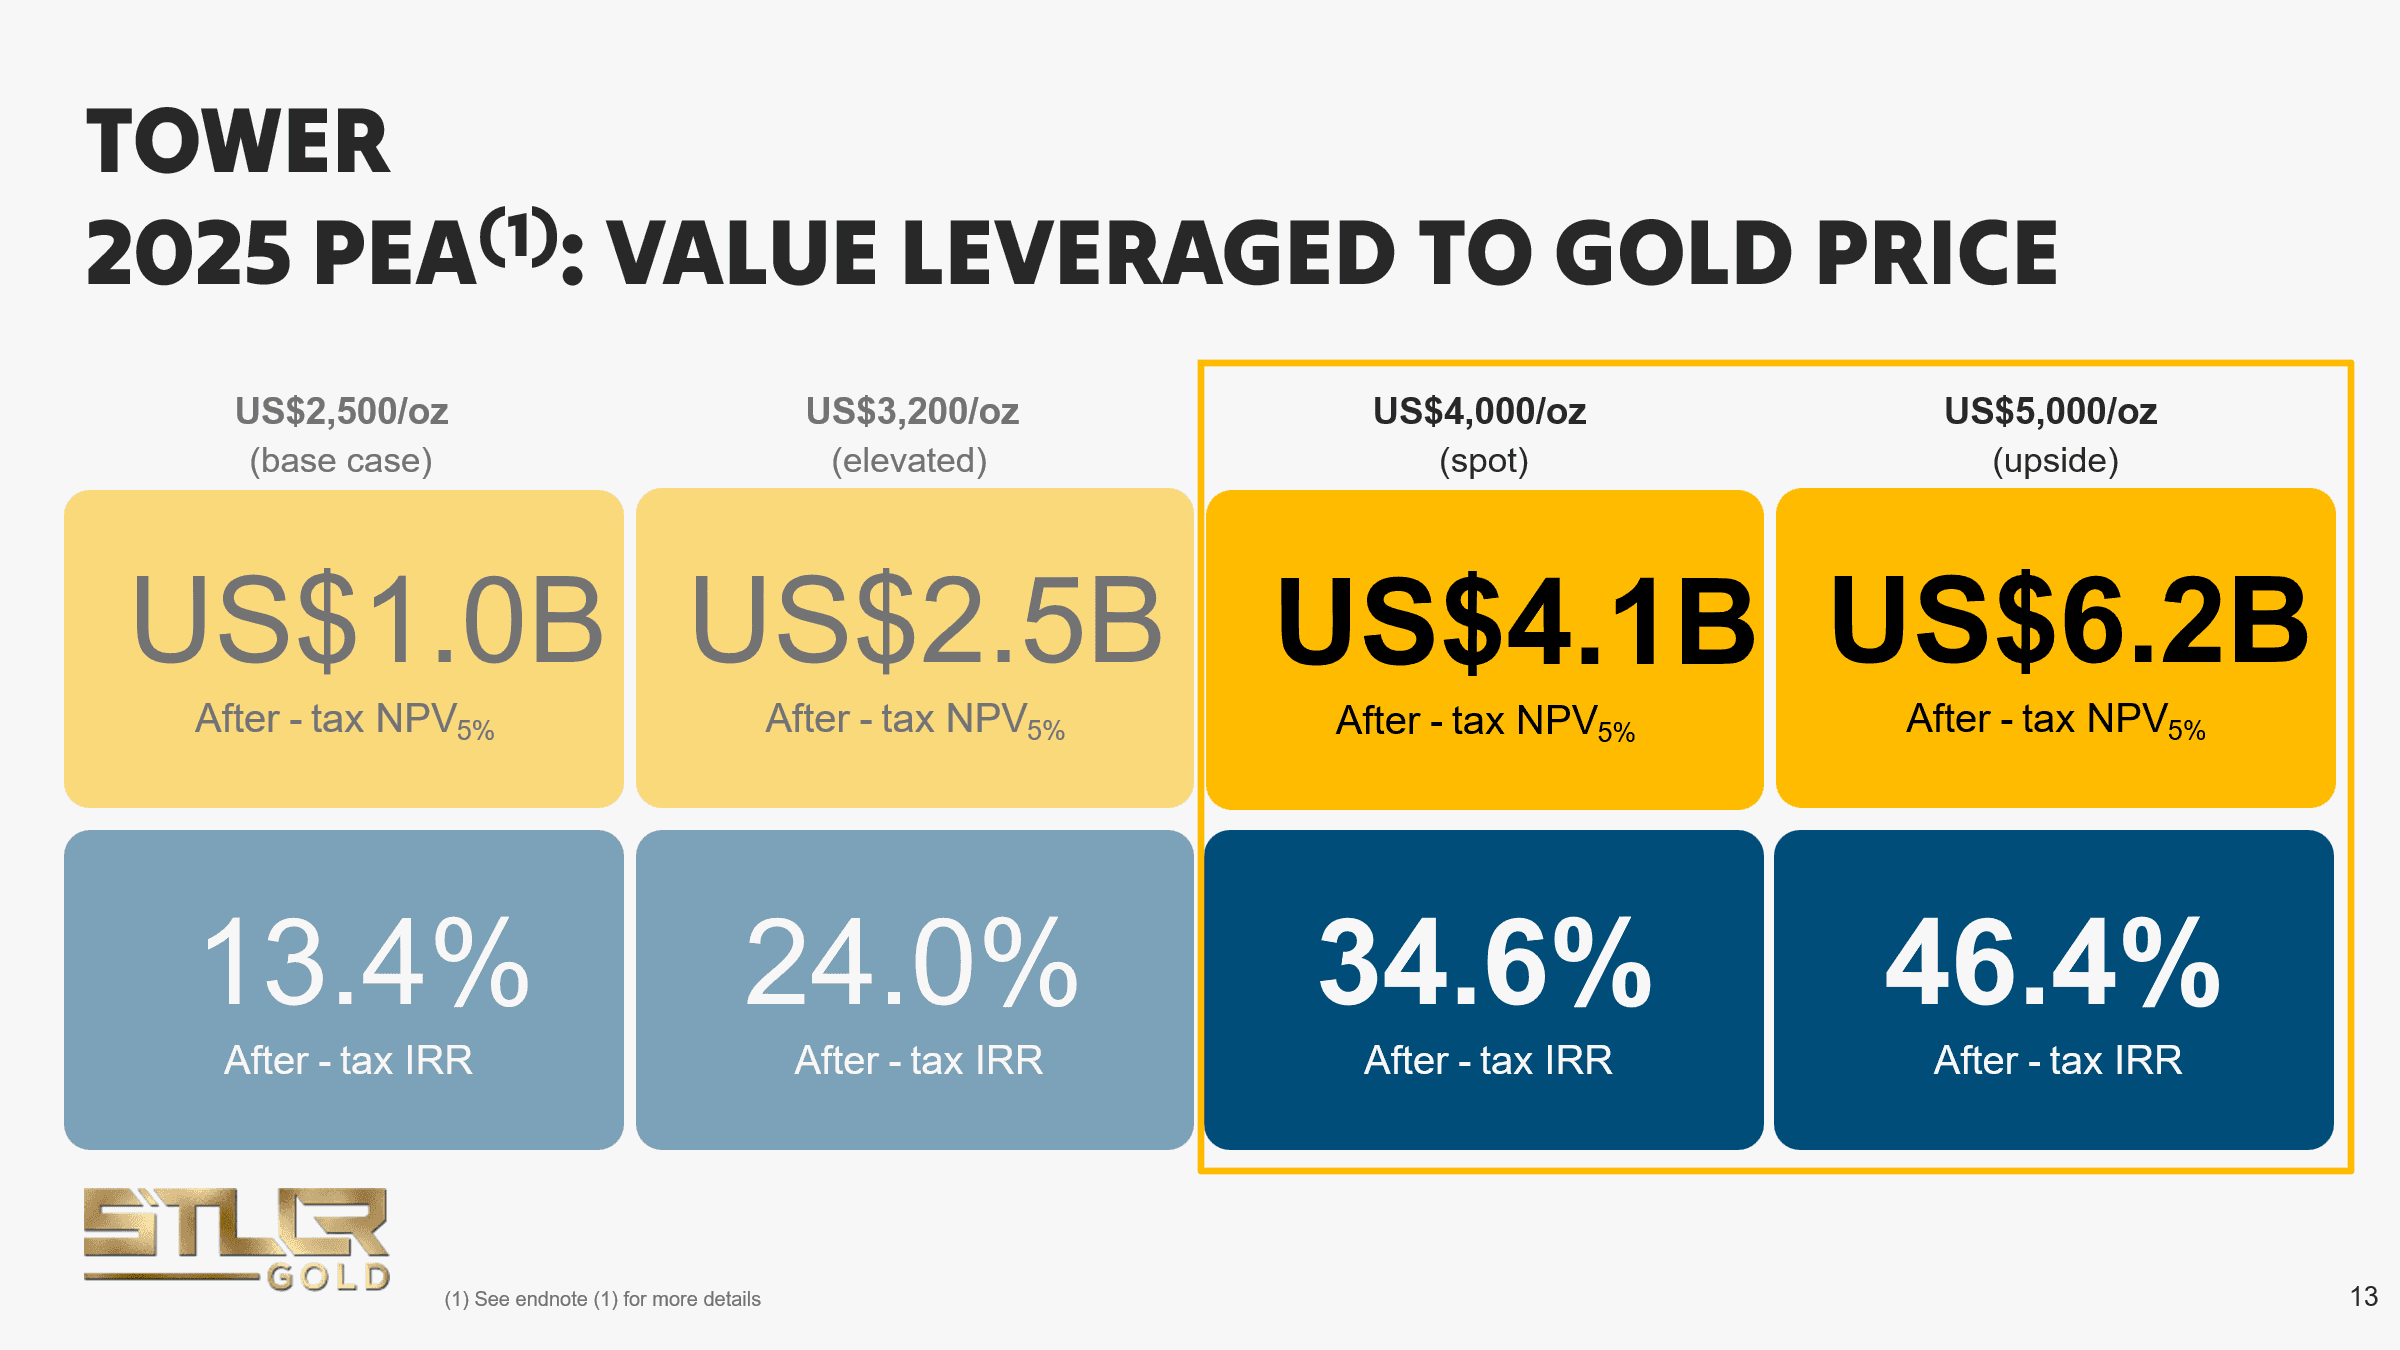
2025 PEA HIGHLIGHTS
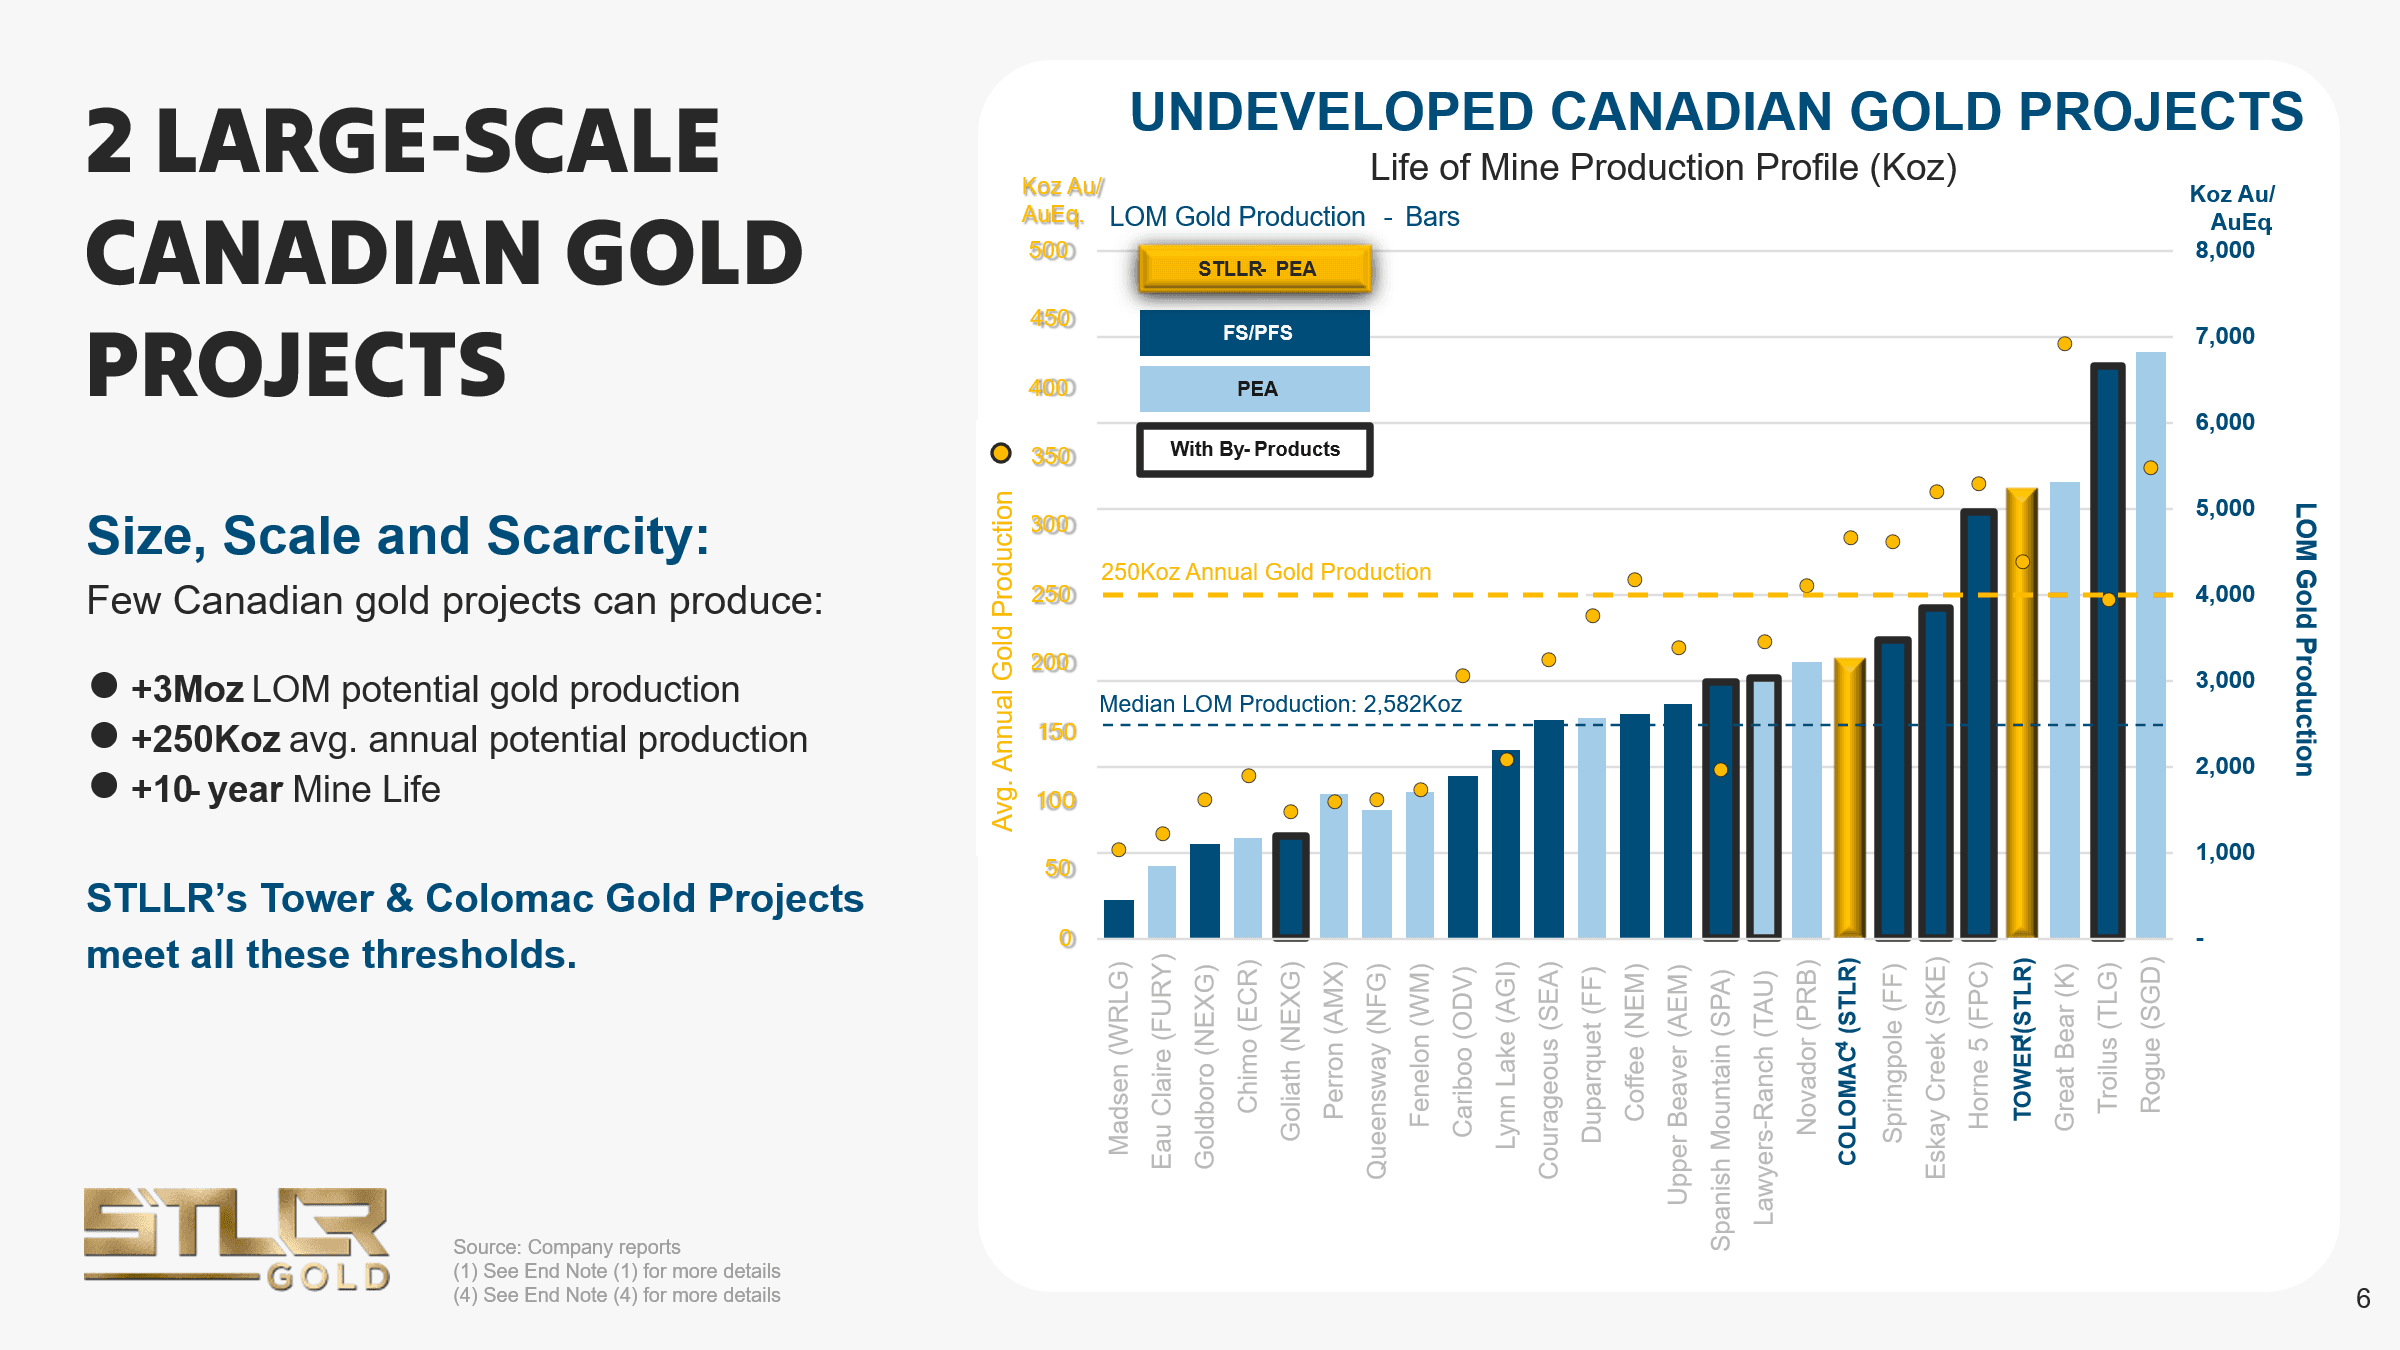
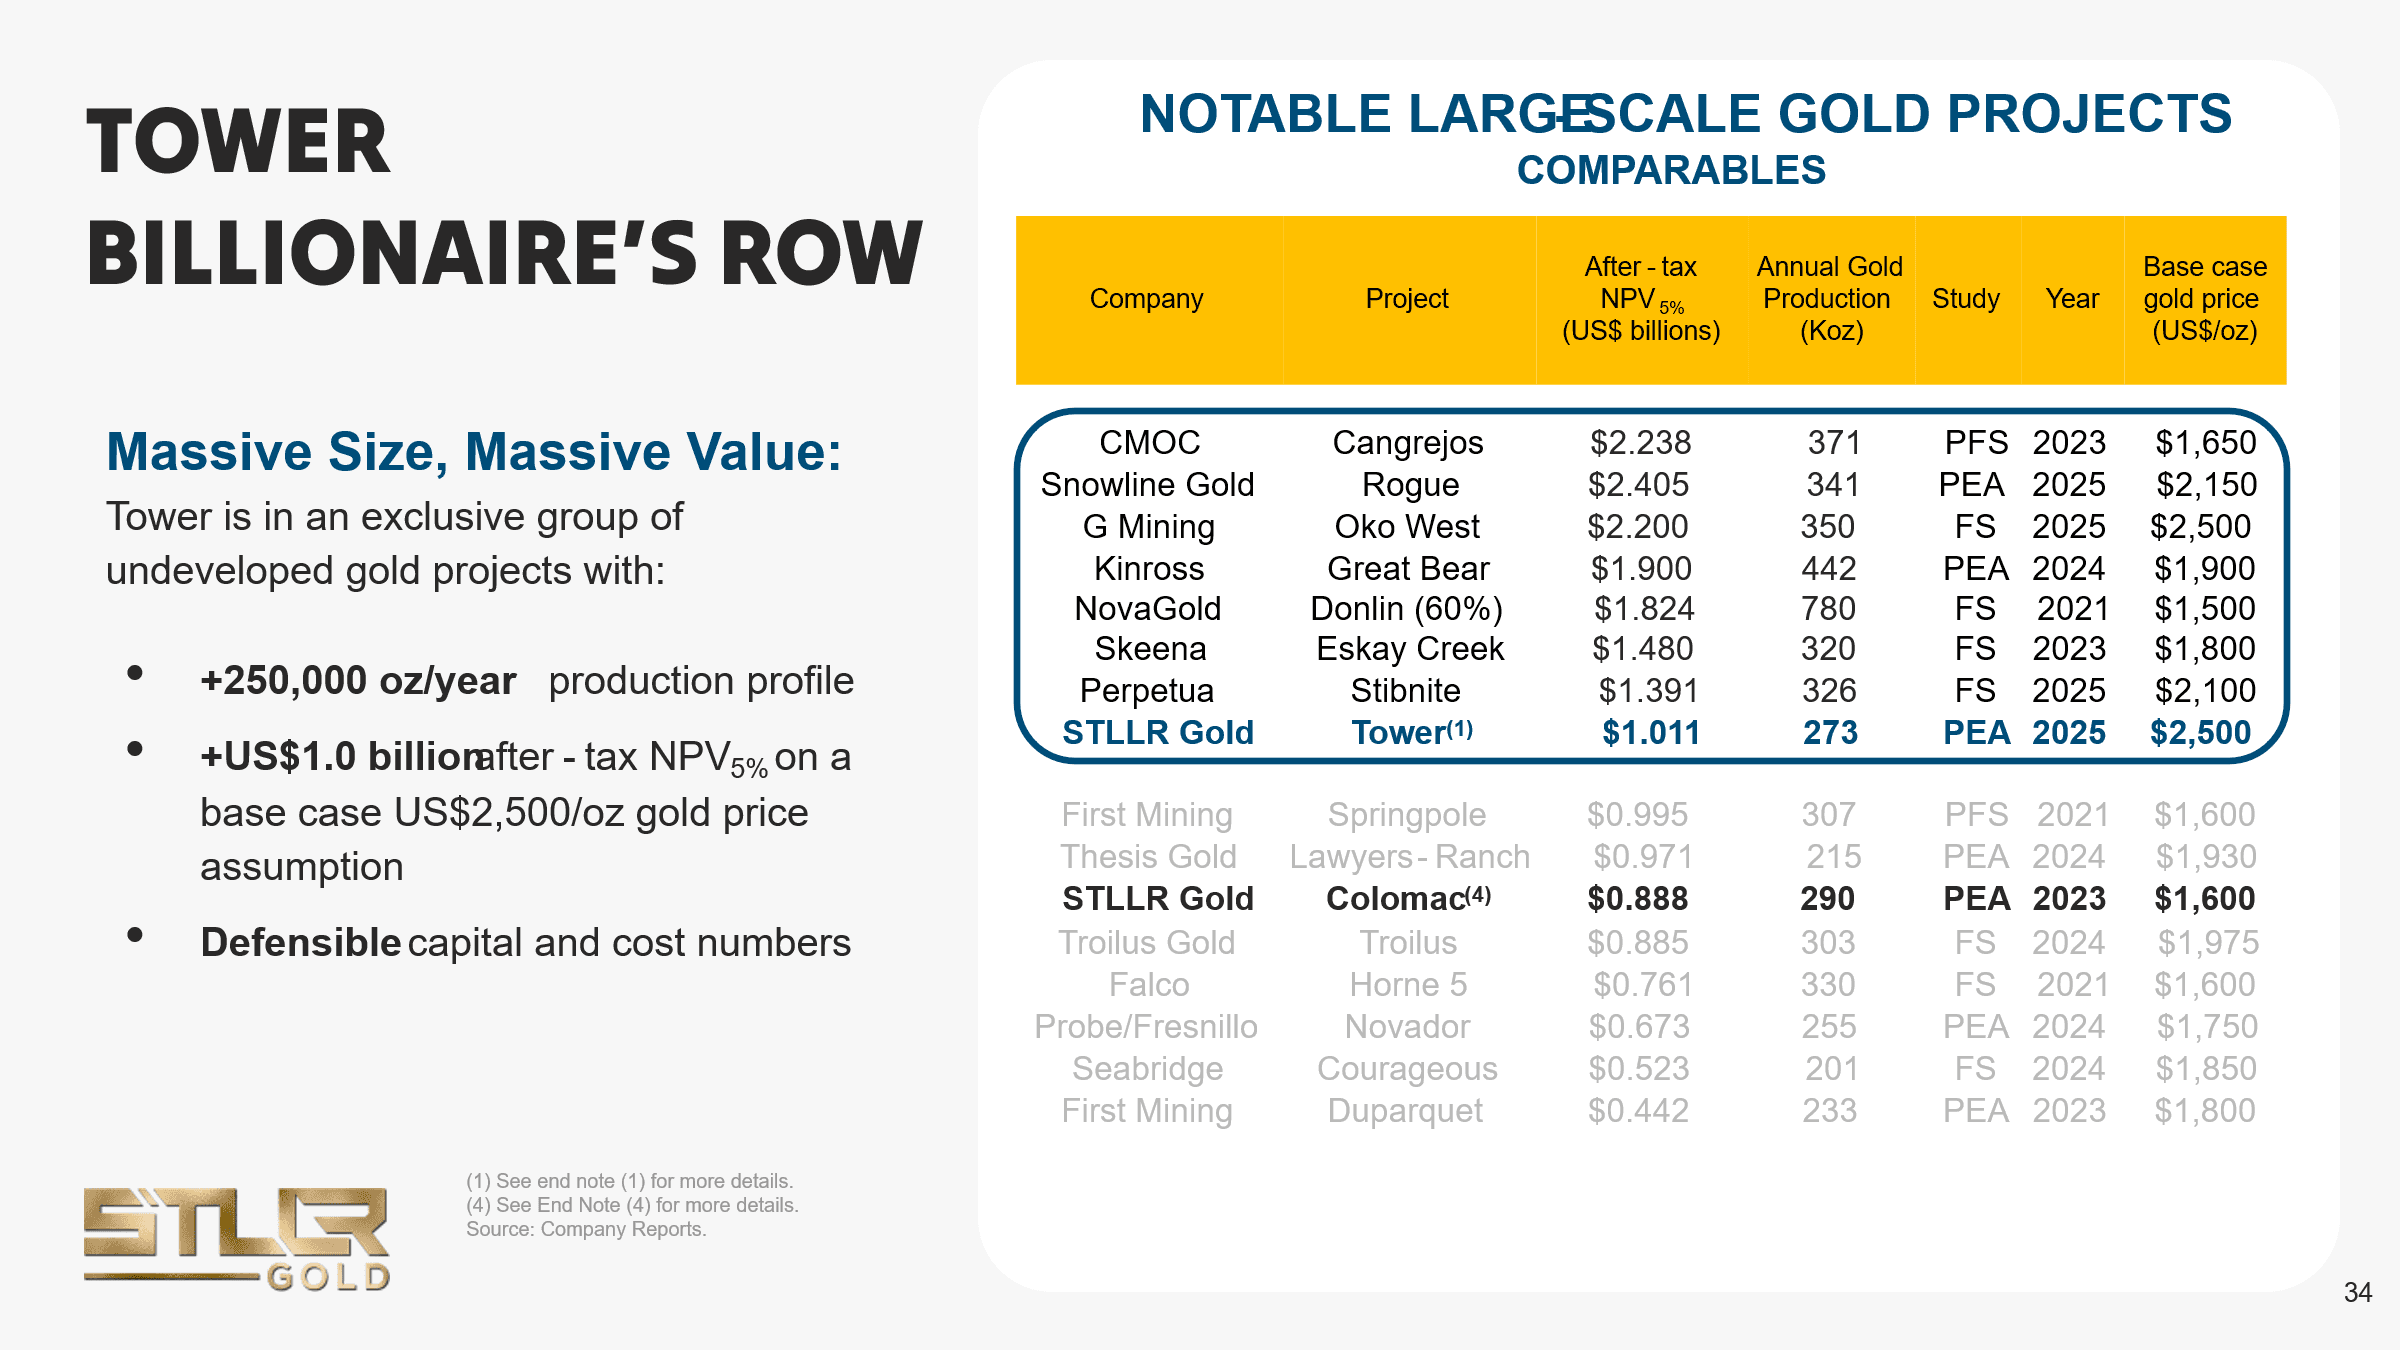
TOWER GOLD PROJECT
STLLR's flagship asset in the renowned Timmins Mining Camp and one of the largest undeveloped gold projects in Canada. |
ARTICLES
Gold Commentary
Gold Market
In December 2025, gold continued to trade near historically elevated levels as it wrapped up a record‑setting year. Gold reached its highest point for 2025 at about $4,533.91 per ounce on December 26 before pulling back slightly, and closed the year near $4,336 per ounce — reflecting an extraordinary gain of roughly +65% to +70% for the year. Throughout December, spot and futures prices generally oscillated in a range just below peak levels, supported by ongoing safe‑haven buying, central bank accumulation, real yield dynamics, and expectations around further Federal Reserve policy shifts.
Influencing Factors
Monetary Policy Expectations
Markets were pricing in significant probability of Fed rate cuts, which tends to lower real yields and boost gold demand as a non‑yielding asset. Technical analysis noted that positioning ahead of potential Fed moves created a supportive backdrop for price stabilization and further upside.
Safe‑Haven Demand & Geopolitical Risks
Global uncertainty and geopolitical tensions — including ongoing conflicts and flashpoints — sustained gold’s appeal as a hedge. This was amplified by events like the U.S. capture of Venezuela’s president in early 2026, which pushed gold up strongly in reaction as a flight‑to‑safety asset, with spot gold rising above $4,400/oz in that response.
Central Bank & ETF Demand
Strong central bank accumulation and high ETF holdings continued to support fundamentals. Even as profit‑taking and year‑end thin liquidity pressured prices sometimes, structural demand remained firm.
Profit Taking & Holiday Season Dynamics
Profit‑booking toward year‑end, margin hikes by the CME Group, and thin holiday trading volumes contributed to episodes of short‑term volatility and slight downward pressure on gold prices in the last trading days of December.
Dollar & Real Yield Effects
A relatively firm U.S. dollar at times put modest headwinds on gold, as a stronger greenback makes gold relatively more expensive for holders of other currencies. Overall, however, real yields remained supportive through much of the month.
Technical Analysis
Price Range & Key Levels
Range: Gold largely traded in a range between roughly $4,200 – $4,550/oz, with the monthly peak around $4,533.91/oz and occasional dips below $4,200 during corrective pullbacks.
Resistance: The major resistance cluster was the $4,380 – $4,400/oz area — representing prior all‑time high zones — with the late‑December peak moving slightly above those levels. Technical analysis identifies this area as a key ceiling that market participants were testing.
Support: Near‑term support held around $4,200 – $4,210, aligning with the rising trendline from November and prior breakout zones. Below this, the $4,000 – $3,950 bracket remains a significant psychological and technical buffer, supported by the 50‑day moving average.
Trend & Momentum Indicators
The medium‑term trend remained bullish, with gold printing higher highs and higher lows — a classic uptrend structure that persisted from October into December. The rising 50‑day moving average acted as dynamic support throughout the month, and momentum indicators like RSI stayed comfortably above neutral levels, suggesting constructive momentum without extreme overbought conditions.
Breakout Attempts
Gold’s push past $4,380 – $4,400 was effectively a breakout above key historical ceilings, reflecting continuation of the strong 2025 rally.
Subsequent pullbacks were shallow and corrective rather than trend‑reversing, indicating buy‑the‑dip behavior among traders — a bullish technical characteristic.
The late‑December volatility (including wide swings after margin changes and thin liquidity) resembled typical year‑end behavior, not structural breakdowns of trend.
Volatility & Consolidation
Volatility remained elevated at times, particularly near year‑end when trading volumes were lower and profit booking increased. However, much of December could be characterized as consolidation at elevated levels rather than a sharp trend reversal. Price action exhibited compressive behavior between support around $4,200 and resistance near the yearly peaks, a pattern often seen when markets digest prior rapid gains before the next directional move.
Conclusion
December 2025 was a continuation of one of the strongest bull markets in gold’s history, with prices peaking near $4,550/oz and establishing structural bullishness. Influencing forces included persistent safe‑haven demand amid geopolitical risk, strong central bank and institutional accumulation, and macroeconomic conditions (real yields and monetary policy expectations) that favored gold. Technically, the uptrend showed continued integrity, with key support levels upheld and breakout tests of resistance zones. While profit‑taking and thin year‑end liquidity introduced volatility, the overall setup remained constructive, with consolidation likely serving as a platform for future directional moves rather than signaling a trend reversal.
Outlook
Short-Term Projections (2026)
Analyst forecasts for 2026 remain broadly bullish but mixed in magnitude. A Financial Times survey of analysts suggests gold will average higher and could rise about 7 % to ~US $4,610/oz by year‑end — with the most bullish calls above $5,400/oz and the most cautious around $3,500/oz.
Central bank demand remains strong — buying from emerging and developed economies continues to absorb supply, underscoring a structural supportive floor under prices.
Safe‑haven flows amid uncertainty, including geopolitical risks and potential inflation surprises tied to new tech investment and broader stimulus, are likely to sustain demand.
Real yields and Fed policy — markets presently price some rate cuts, which if delivered, could depress real interest rates and favor gold.
Risks Specific to 2026
If inflation reaccelerates (e.g., via AI‑related cost pressures) and the Fed delays or reverses rate cuts, gold may face headwinds.
Technical euphoria in early 2026 may invite profit‑taking and increased volatility, indicating upside is not uniform or uninterrupted.
Probable 2026 Range
Base Case: $4,200 – $5,000
Bull Case: $5,000+ (especially if geopolitical events or sustained real rate declines occur)
Cautious: ~$3,800 – $4,200 (if rate cuts disappoint or markets reprioritize risk assets)
Medium-Term Projections (2027–2030)
Over the medium term, structural forces point toward continued upward pressure on gold, albeit with cyclical ebbs and flows.
Key Drivers:
Long‑lasting central bank reserves strategy: The trend of reserve diversification — especially in Asia, the Middle East, and parts of Europe — is expected to endure, keeping demand firm.
Inflation and monetary policy risks: Persistent inflation or renewed price pressures (even outside core CPI measures) could weaken real yields over time and elevate gold’s appeal.
Geopolitical and fiscal stress creates recurring episodes of safe‑haven demand.
Forecast price range by 2030:
Base Case 2030: $5,000 – $6,000
Bullish Structural Scenario: $6,000 – $7,000+ (driven by episodes of macro instability, currency debasement, or persistent low/negative real rates)
Conservative: $4,000 – $5,000 (if global growth and rate normalization persist)
Long-Term Projections (Beyond 2030)
In the long run, gold’s role as a store of value, reserve asset, and inflation hedge could become even more pronounced, with several structural catalysts:
Drivers
Monetary regime evolution: A multipolar reserve system, continued de‑dollarization, or integration of gold into new payment/settlement frameworks could elevate gold’s monetary significance.
Supply constraints: Tight physical supply due to declining ore grades and limited exploration can support higher price floors.
Persistent fiscal imbalances may undermine fiat confidence in certain regions, boosting gold demand.
Price Implications
Forecasts into the 2030s show potential price levels well above mid‑2020s norms, with several analysts and market models projecting >$7,000/oz under stress scenarios.
Extreme tail scenarios — such as currency crises or major monetary policy disruptions — could elevate gold further beyond these ranges.
Summary
Gold’s price outlook through 2026 and beyond is robustly bullish, supported by powerful macro and structural drivers. In late 2026, prices appear positioned to trend higher, potentially approaching or surpassing $5,000/oz amid persistent demand and price momentum. Over the medium term (2027‑2030), structural accumulation by official and private investors, along with geopolitical and monetary uncertainty, suggests higher average levels — likely in the $5,000‑$6,000+ range. Looking beyond 2030, gold’s role as a strategic asset is expected to deepen, with long‑term prices potentially rising substantially in scenarios of systemic stress or changes to global monetary frameworks.
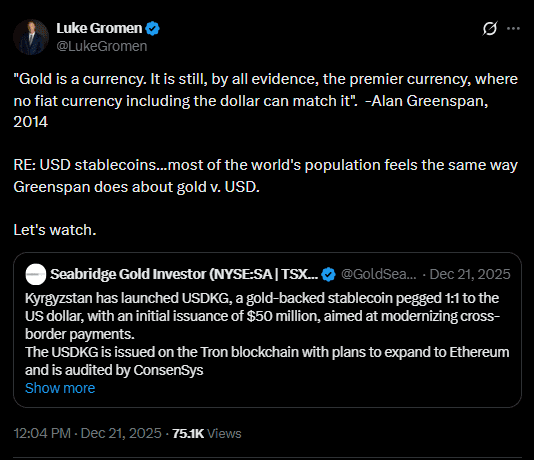
Gold on Socials
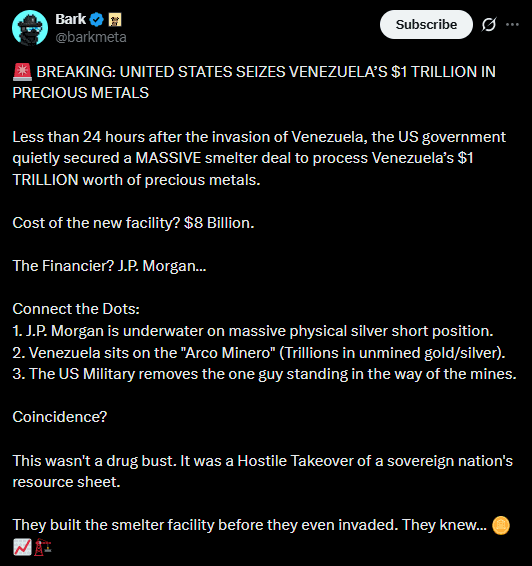
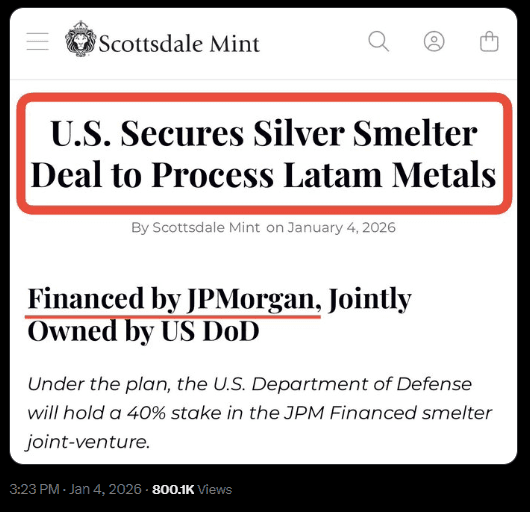
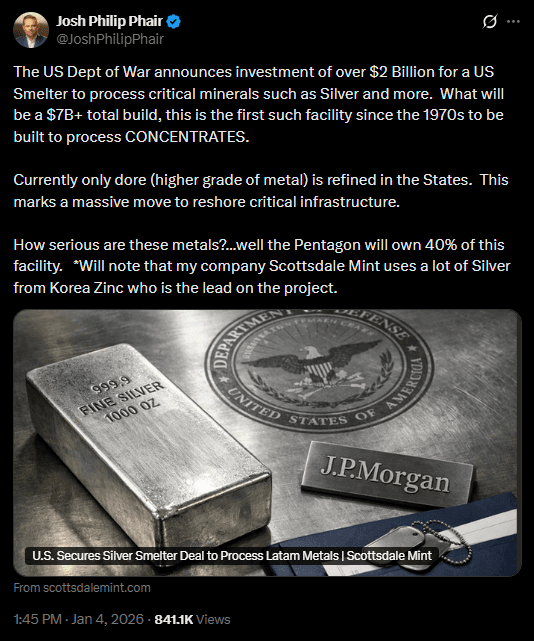
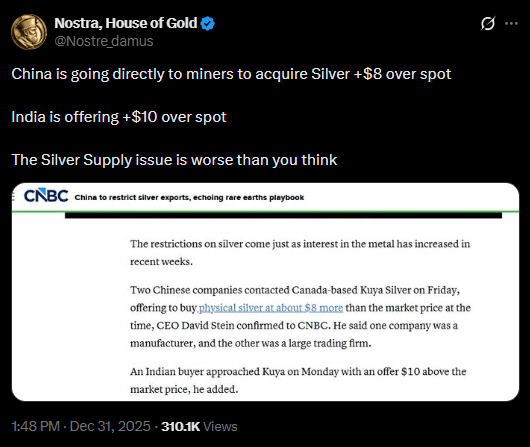
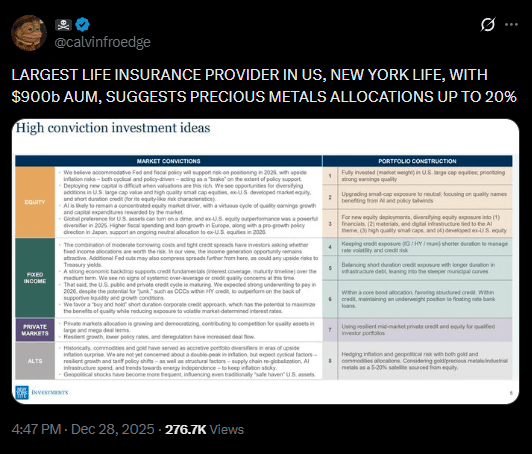
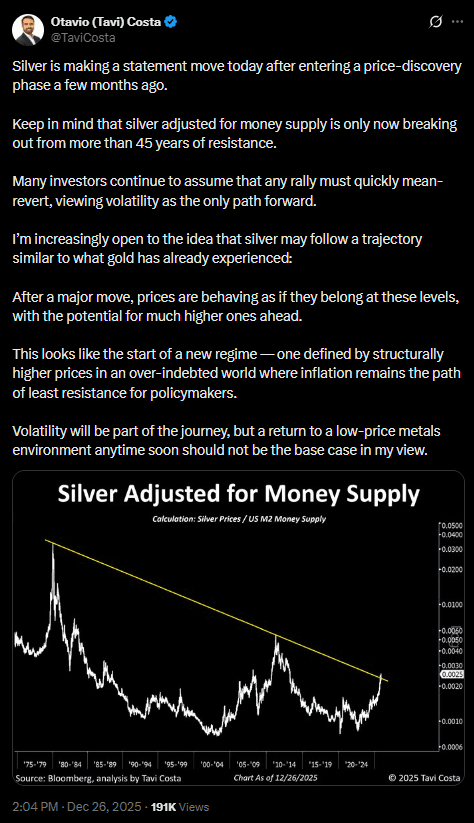
Interesting Posts on X.com
Price Performance & Forecast
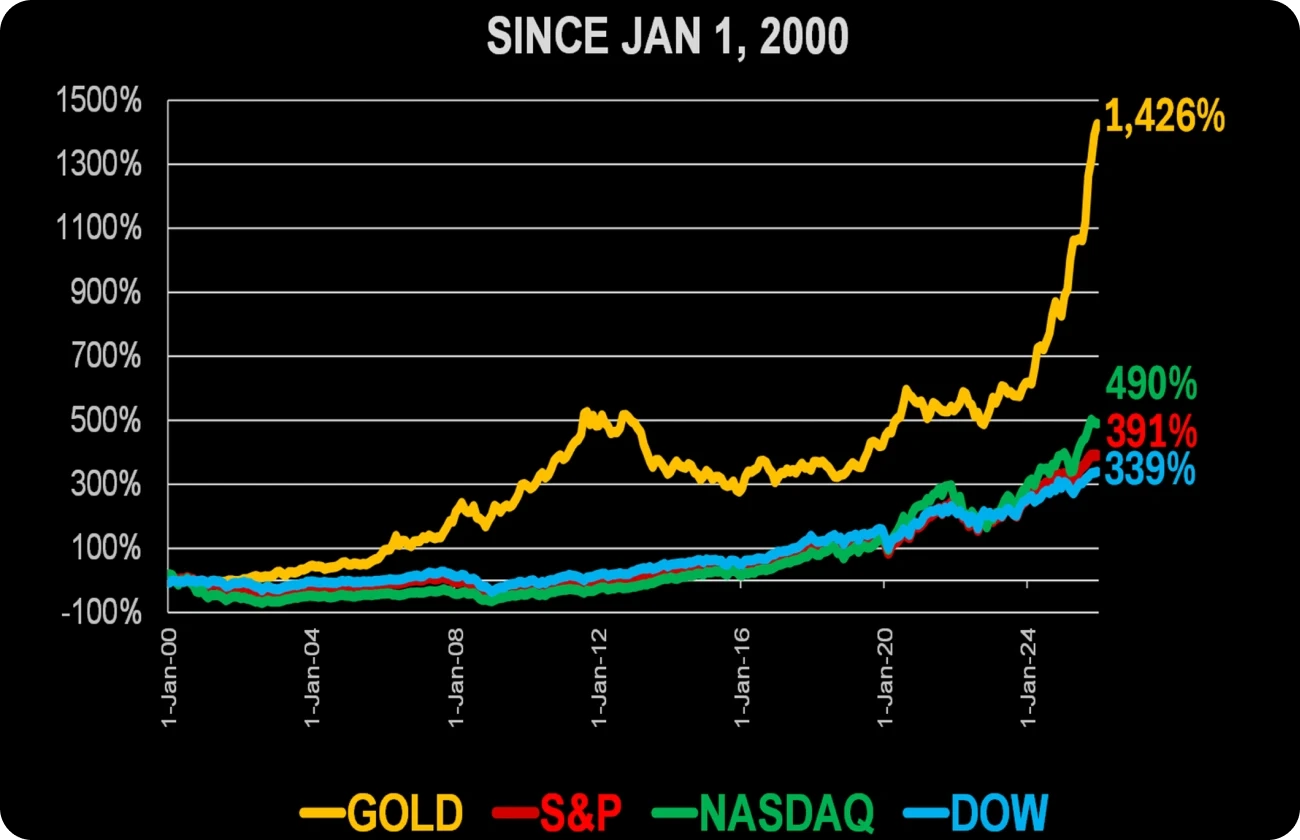
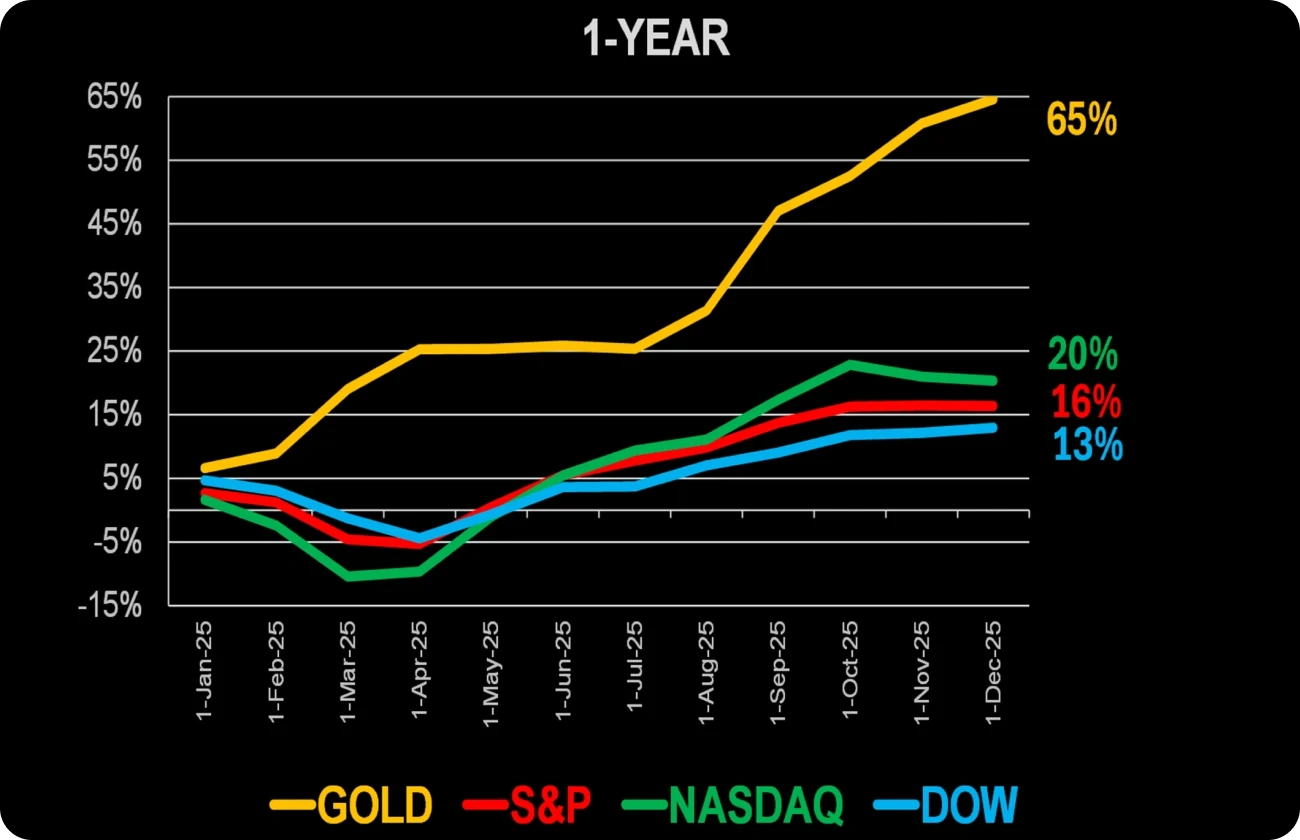
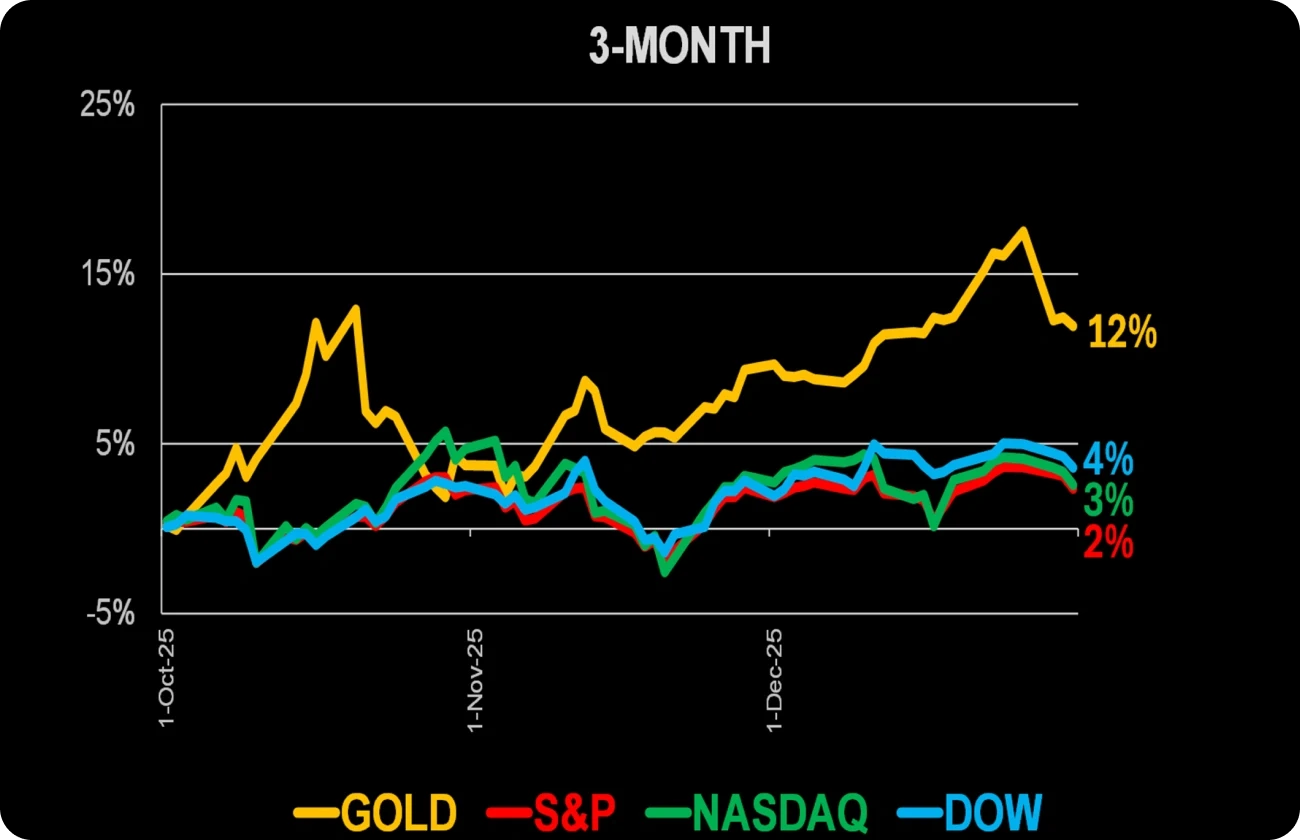
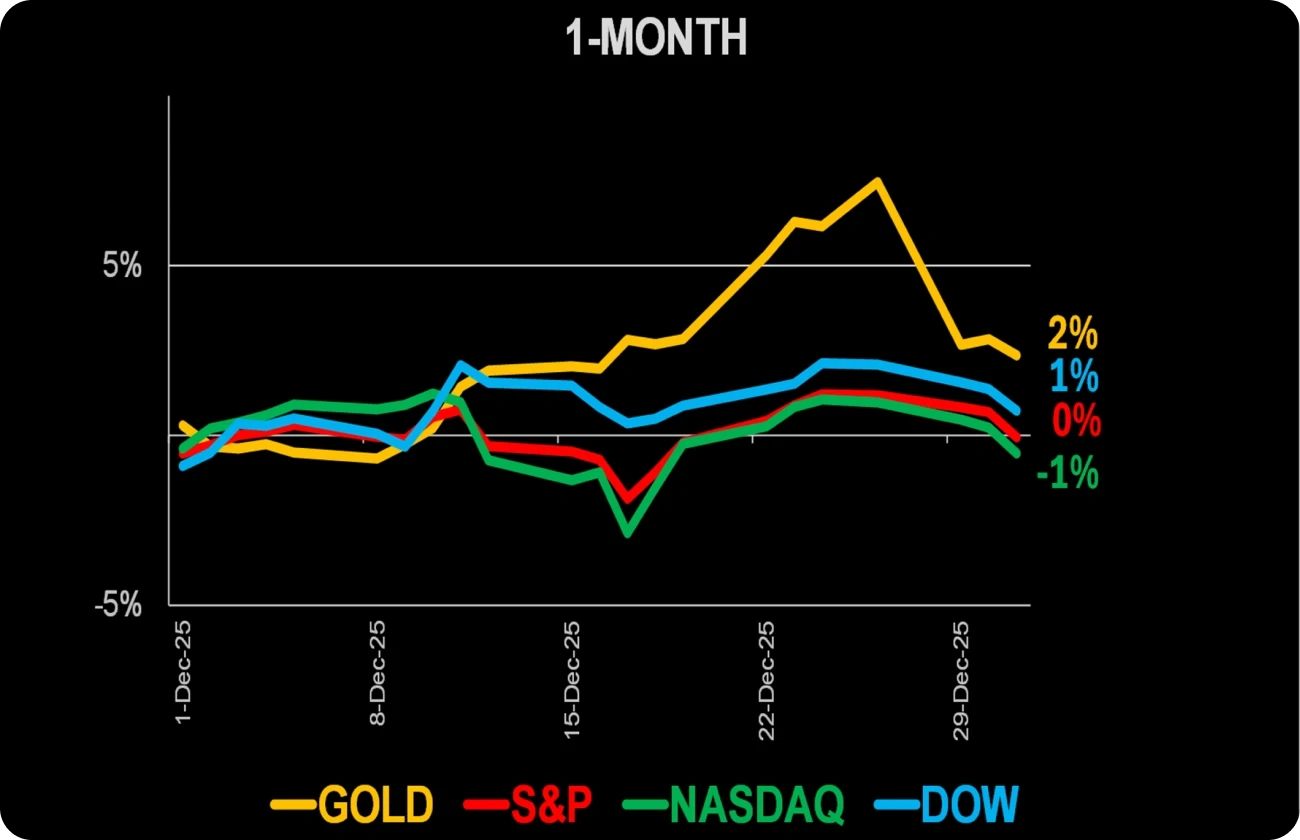
Price Performance Charts:
Since January 1/20, 1-Year, 3-Month, 1-Month
Gold Price vs. S&P 500 vs. Nasdaq vs. Dow Jones ending October 31, 2025
(Source: WGC, STLLR Estimates, TradingView)
STLLR Management Share Purchases
We have Skin in the Game! |
Gold Price Performance Per Currency
Currency
Dec-25
1-Year
USD
+5.1%
+62.2%
Euro
+3.8%
+45.3%
JPY
+5.5%
+65.0%
GBR
+3.3%
+53.7%
CAD
+3.3%
+57.5%
CHF
+4.3%
+45.4%
INR
+6.9%
+72.3%
CNY
+4.2%
+57.1%
TRY
+6.0%
+98.0%
SAR
+5.1%
+62.0%
IDR
+5.0%
+68.9%
AED
+5.1%
+62.2%
THB
+2.7%
+50.3%
VND
+5.0%
+68.1%
EGP
+5.4%
+52.6%
KRW
+5.7%
+66.0%
RUB
+2.9%
+22.4%
ZAR
+2.9%
+51.0%
AUD
+3.0%
+55.3%
(Source: WGC, Goldprice.org)
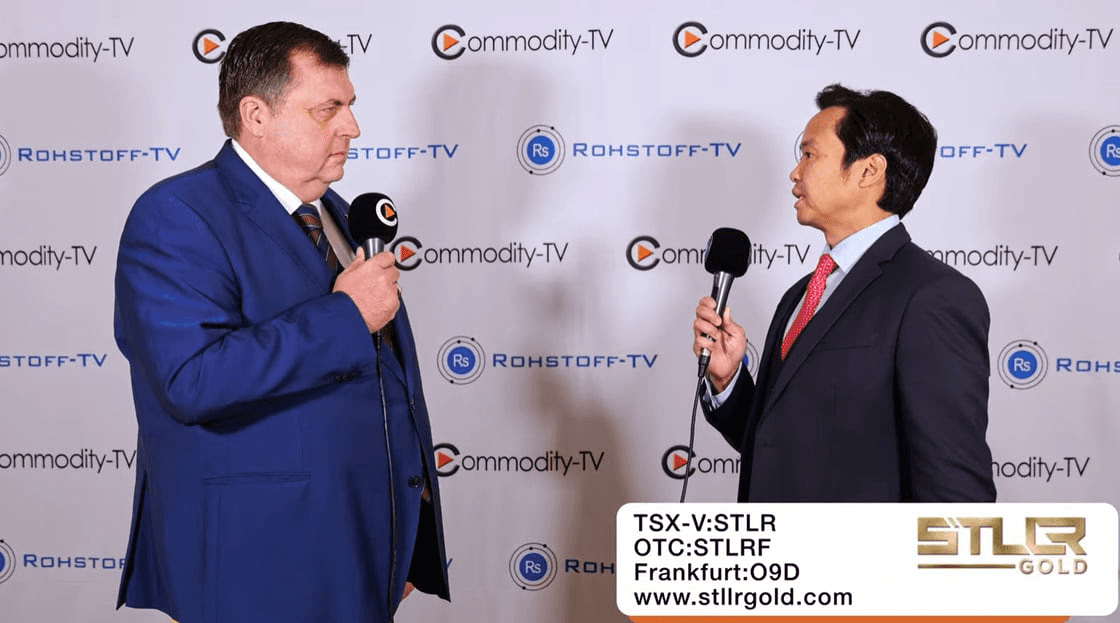
The David Lin Report with Keyvan Salehi, President & CEO
December 2025
Precious Metals Summit Zurich Interview with Allan Candelario, VP, Corporate Development & Investor Relations
November 2025
UP NEXT: Tune in to the next VNDR with STLLR Gold's CFO, Salvatore Curcio.
January 22, 2026
CONNECT WITH US
Let’s Start a Conversation
We value open communication with our investors. Connect with us through social media or reach out directly:
Fill out the form below to start your journey with STLLR Gold.
Our team is ready to assist you.


